Real-Time Production Dashboards Details: Features, Production Data, KPIs and Monitoring Methods
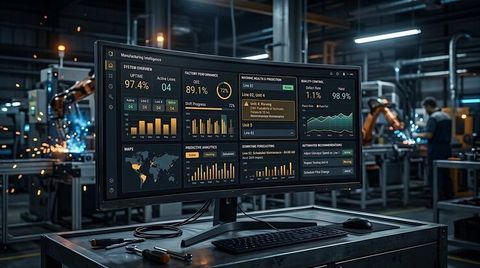
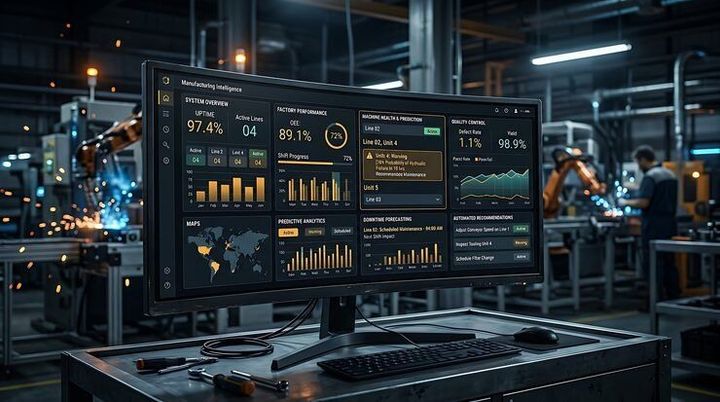
A real-time production dashboard is a digital display that brings current manufacturing information into one view. It can show production counts, machine states, cycle times, quality results, downtime, inventory signals, and other production data as operations change. The idea comes from the wider development of factory automation, manufacturing execution systems, industrial Internet of Things (IIoT), and Industry 4.0.
Earlier production monitoring often depended on paper records, spreadsheets, operator reports, or information collected after a shift. Modern systems can collect data from machines, sensors, control systems, databases, and production software and present it through dashboards. This creates a shared view of what is happening on a production line rather than relying only on historical reports.
Importance
Real-time production dashboards matter because manufacturing decisions can depend on information that changes from minute to minute. A delayed report may show that a production target was missed, while a live dashboard can show whether the cause is downtime, slow cycle time, material availability, quality losses, or another operational issue.
These dashboards affect operators, supervisors, maintenance teams, quality personnel, production planners, and managers. For a general reader, the main idea is simple: production data becomes easier to see, compare, and interpret when important indicators are displayed together.
Common problems addressed
A dashboard can help organize information related to:
- Machine downtime and operating status
- Units produced during a shift
- Planned versus actual production
- Cycle time and throughput
- Scrap, defects, and rework
- Equipment utilization
- Production orders and progress
- Energy or material readings
- Quality inspection results
The value of a dashboard depends on data quality. If sensors are inaccurate, production records are incomplete, or different systems use inconsistent definitions, a visually clear dashboard can still present an incomplete picture.
Key production KPIs
Production KPIs are measurements used to describe operational performance. Common examples include Overall Equipment Effectiveness (OEE), throughput, cycle time, downtime percentage, first-pass yield, scrap rate, and schedule attainment.
OEE is often discussed through three elements: availability, performance, and quality. A dashboard may display each element separately so that users can see which factor is affecting the combined measure.
| Production KPI | What it indicates | Typical data source |
|---|---|---|
| Throughput | Quantity produced over a period | Machine or production records |
| Cycle time | Time needed for a production cycle | Machine or operator records |
| Downtime | Time when equipment is not producing | Machine status or event logs |
| OEE | Combined view of availability, performance, and quality | Production and quality data |
| Scrap rate | Share of output rejected as scrap | Quality records |
| First-pass yield | Output meeting requirements without rework | Inspection records |
| Schedule attainment | Actual production compared with planned production | Production planning records |
Recent Updates
From 2024 through 2026, manufacturing technology in India has continued moving toward connected production systems, Industry 4.0, industrial analytics, and real-time monitoring. The Ministry of Heavy Industries has reported work through SAMARTH Udyog Bharat 4.0, including Industry 4.0 experience centres and model-factory activities.
Government activity has also expanded the use of data-driven dashboards beyond individual factories. In 2025, the Koyla Shakti Smart Coal Analytics Dashboard was launched to monitor coal production, transportation, and consumption through a unified digital interface. This illustrates how real-time production data can be combined with information from connected parts of an industrial system.
The National Manufacturing Mission announced in the 2025–26 Union Budget places technology availability, workforce readiness, MSME development, and quality manufacturing among its focus areas. These priorities support wider discussion of digital manufacturing and connected production data.
In 2026, government discussions around artificial intelligence for Manufacturing Engineering Technology also highlighted AI, skills development, and responsible adoption. NITI Aayog's manufacturing roadmap has identified AI and machine learning, digital twins, robotics, and related digital infrastructure as important technologies for advanced manufacturing.
Current monitoring methods
Production dashboards are increasingly combined with edge computing, cloud databases, industrial IoT sensors, machine connectivity, analytics, and digital twins. Some factories also use AI-based analysis to identify unusual patterns in machine or production data.
Another trend is interoperability. Instead of keeping machine, quality, maintenance, and planning information in separate screens, organizations increasingly seek standardized data structures and interfaces that allow different systems to exchange information. NITI Aayog's manufacturing roadmap specifically discusses secure digital infrastructure, standardized machine-data protocols, APIs, and interoperable technical standards.
Laws or Policies
In India, a production dashboard does not operate under one single dashboard-specific law. The relevant rules depend on the type of information collected, the industry, the workplace, and how the technology is connected to other systems.
The Digital Personal Data Protection Act, 2023 and the Digital Personal Data Protection Rules, 2025 are relevant when a production system processes digital personal data. The final Rules were notified in November 2025 and establish a phased commencement framework. A dashboard that contains identifiable worker information therefore needs to consider applicable data-protection requirements rather than treating every production record as anonymous operational data.
Workplace safety rules are also relevant. India's occupational safety framework covers health, safety, and working conditions in establishments. The Ministry of Labour and Employment maintains information on the Occupational Safety, Health and Working Conditions Code, 2020 and related rules. Production dashboards may support monitoring, but a dashboard itself does not replace statutory safety procedures, inspections, records, or workplace controls.
Factories also need to consider applicable state-level requirements and sector-specific rules. The Ministry of Labour notes that factory safety requirements have historically been implemented through central legislation together with state rules and enforcement arrangements.
Tools and Resources
Different tools can support real-time production dashboards, depending on the size and structure of a manufacturing operation. Common categories include Manufacturing Execution Systems (MES), Enterprise Resource Planning (ERP) platforms, Supervisory Control and Data Acquisition (SCADA) systems, industrial IoT gateways, business-intelligence platforms, and database tools.
A useful dashboard usually begins with clearly defined data sources. Machine signals may come through industrial communication protocols, while production orders may come from an ERP or MES. Quality information can come from inspection systems, and maintenance events can come from maintenance records.
For organizations assessing digital readiness, the Government of India's National Productivity Council provides the Bharat 4.0 Digital Readiness Assessment Tool. It is designed to assess an organization's Industry 4.0 maturity across five levels and can help structure discussions about digital transformation.
Other practical resources include OEE calculation templates, KPI dictionaries, production-data models, SCADA documentation, MES reference material, and business-intelligence dashboard templates. Tools such as Power BI, Grafana, and industrial visualization platforms can be used to build dashboards, while spreadsheets remain useful for smaller data sets and initial KPI definitions.
A dashboard design should also make the meaning of each metric clear. For example, “downtime” should have a defined start and end condition, while “units produced” should specify whether rejected units are included. Consistent definitions make comparisons between machines, shifts, and production lines easier to interpret.
FAQs
What is a real-time production dashboard?
A real-time production dashboard is a digital display that presents current or frequently updated manufacturing information. It can include production counts, machine status, downtime, quality data, cycle time, and other production KPIs.
What production data can a dashboard monitor?
Production data can include output quantities, machine states, cycle times, downtime events, quality results, scrap, rework, production orders, and selected energy or material readings. The available information depends on the connected machines and software systems.
Which KPIs are commonly used in production dashboards?
Common production KPIs include throughput, cycle time, downtime, OEE, scrap rate, first-pass yield, equipment utilization, and schedule attainment. Each KPI needs a clear definition so that users interpret the measurement consistently.
How do real-time production dashboards collect data?
Dashboards can receive information from sensors, programmable logic controllers, machines, SCADA systems, MES platforms, ERP databases, quality systems, and manual entries. Data may be processed at the machine level, on local edge systems, or in centralized databases before visualization.
Can small factories use real-time production dashboards?
Yes. A small operation can begin with a limited set of production KPIs and a smaller number of data sources. A spreadsheet or simple visualization system may be sufficient for basic monitoring, while larger operations may connect many machines and production systems.
Conclusion
Real-time production dashboards bring changing manufacturing information into a common visual format. They can display production data, KPIs, machine conditions, quality information, and progress against planned output. From 2024 through 2026, Indian manufacturing initiatives have continued to emphasize Industry 4.0, connected data, AI, and digital monitoring. The usefulness of a dashboard depends on accurate data, clear KPI definitions, suitable system integration, and compliance with applicable workplace and data-protection requirements.